


This chapter provides an overview of how the DAS method works in practice. Following the first two chapters about the ideas underpinning DAS and why the method emerged, this chapter explains how the work proceeds at an overall level—step by step and concept by concept. DAS always moves through three steps: design, action, and sampling with associated analysis. In the design phase, the purpose, action tasks, tags and pace are shaped. In the next step, action, the tasks are carried out and reflections are written while the experience is still fresh in memory. In the third step, the empirical material is analysed together, both in numbers and in narratives, until patterns and conclusions emerge.
To understand DAS, you also need to know six central concepts that recur throughout the process: form, action task, tag, feeling, comment thread and content package. Together they form the structure that makes it possible to design, analyse and share everyday experiences in ways that are both practical and scientific. This chapter describes each step and each concept in turn—how it works, why it exists, and what role it plays in the whole.
3.1 Step 1: Design of Purpose, Action Tasks, Tags and Pace
Work with DAS begins by shaping the framework for the study itself—the purpose, action tasks, tags and pace. Everything starts from a clear and engaging inquiry question. It should be specific enough to be investigated through the data that will later be collected, but also meaningful enough to spark engagement among all who participate. A good inquiry question focuses on a defined phenomenon, uses clear concepts, is open rather than yes-no oriented, and points toward a possible contribution. When the question feels both important and personal, a powerful driving force is created throughout the process.
The next step is to design testable actions—the action tasks that participants will carry out. Kolb’s learning cycle is used as guidance here: plan, act, feel, reflect, see Figure 3.1. Each action task describes a concrete action that is expected to lead to learning when followed by reflection. A selection of tags is connected to these action tasks—short, precise phrases of no more than five words that capture the effects, experiences, or behaviours of particular interest.
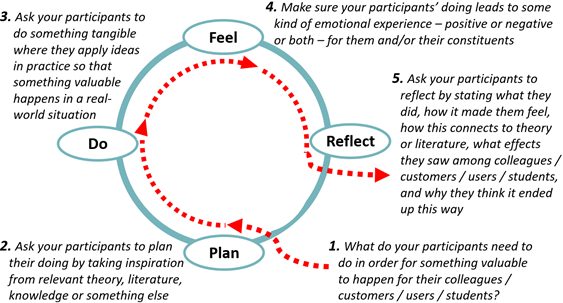
Figure 3.1. Kolb’s learning cycle applied to action task design in DAS.
Finally, ethical frameworks and pace are established. Decisions are made about who reads what, who gives feedback, how data will be handled, and how often reflections should be made. These choices provide both security and rhythm to the work and form the foundation on which the rest of the DAS process can be built.
Finally, you establish ethical boundaries and pace. Who reads what? Who gives feedback? How will data be handled? How often should people reflect? These choices provide both security and rhythm to the work and form the foundation on which the rest of the DAS process can be built.
Read more:
Kolb, D. A. (1984). Experiential learning: Experience as the source of learning and development. Prentice Hall.
Lackéus, M. (2021). Den vetenskapande läraren. Kapitel 5.
3.2 Step 2: Let Others Take Action and Reflect
When purpose, action tasks and tags are formulated, it’s time to invite others to participate. This is the moment when a DAS study comes to life. Participants try the designed action tasks in their own everyday lives and then reflect on their experiences in a digital form. The reflections function as a bridge between action and analysis—each time a participant carries out an action task, a reflection is made afterwards, which makes it possible to collect data while learning is ongoing.
Managing many participants and large amounts of reflections in this step requires digital support. In our handbook, we use the IT support Loopme to explain DAS, a platform developed by researchers at Chalmers specifically for DAS-based data collection and analysis. In a tool like Loopme, the study leader creates a group, enters their action tasks and tags, and then invites all participants to register, which happens via email or through a code displayed on the board or projector screen.
When reflections start coming in from participants, the experience becomes a bit like on a social media platform, see figure 3.2 below. This enables a relationship to be established between study leaders and participants. It’s then important to give feedback quickly—preferably within one to two days. The personal response from study leaders shows that each reflection is taken seriously, which strengthens the relationship, engagement and depth of reflection in continued work. The comments that get written also become part of the data material that is later analysed. This step can last anywhere from a few hours to over a year, depending on the scope and character of the action tasks. Regardless of timeframe, it’s crucial that participants experience the process as meaningful, otherwise both action and reflection will be absent.
Read more:
Lackéus, M. (2020). Collecting digital research data through social media platforms: can ‘scientific social media’ disrupt entrepreneurship research methods? . In W. B. Gartner & B. Teague (Eds.), Research Handbook of Entrepreneurial Behavior, Practice, and Process. Edward Elgar Publishing.
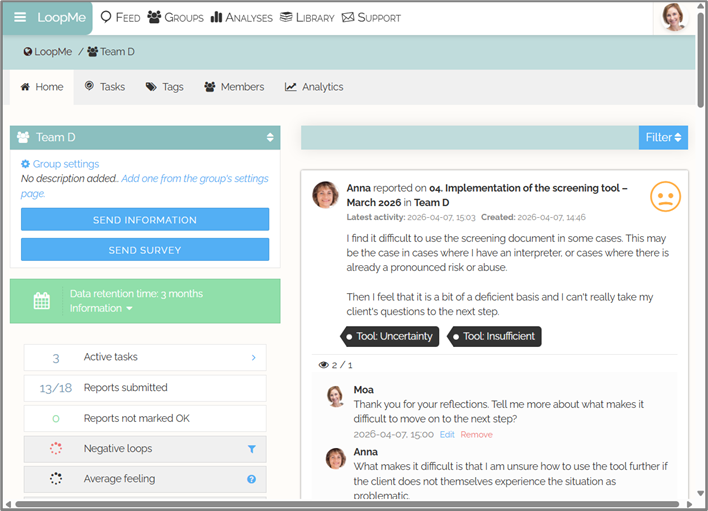
Figure 3.2. Loopme as an example of a scientific social media platform.
3.3 Step 3: Sample the Effect – Analyse All Collected Data Together
Already when participants have been invited, the final phase begins—analysing the material. In DAS, this happens in three steps that together make the analysis both deep and participatory. First, the flow of incoming reflections is followed in real time. This formative analysis—while the study’s outcome is still being “formed”—gives an early sense of what is happening and makes it possible to discover tendencies and patterns. Reading and commenting on participants’ texts becomes like following their learning journeys up close—a kind of ethnographic participation that both documents your thoughts during the journey and deepens understanding.
When all reflections have come in, a more systematic processing of the data is done. Here statistics are compiled about number of reflections, average feelings, tags and action tasks. The overview with numbers gives a “satellite view” of the whole, while close reading of selected reflections offers a “street view” where details and cause-effect patterns emerge. The combination of numbers and text makes it possible to see both breadth and depth in participants’ experiences.
The third analysis step is collective analysis, where compilations are shared with all participants. This can be done digitally or in workshop form. Together you interpret what you see, compare insights, and also collect new reflections. In this way, analysis doesn’t become an ending, but a shared learning process where understanding grows and is anchored among all who participated. Collective analysis creates a strong sense of participation and meaningfulness, because everyone gets to contribute to interpreting the results and see how their own experiences become part of a larger shared learning. Figure 3.3 below shows an example of a task-tag matrix, which is a common type of data analysis compilation. In the tool Loopme, such matrices can be generated with a click of a button and then analysed interactively—each cell in the matrix can be clicked to see the underlying reflections.
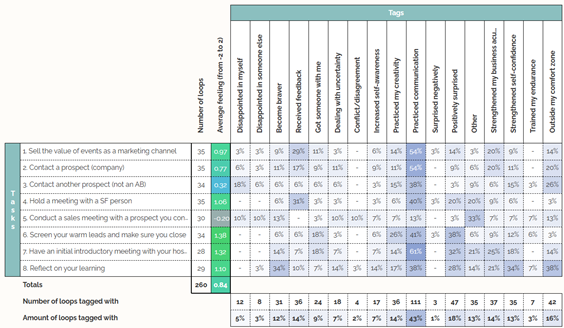
Figure 3.3.Example of a task-tag matrix where different action tasks have been tagged in different ways by around 30 participants. This example relates to value creation pedagogy in higher education. A group of students has tried to engage external stakeholders in a collaboration where they jointly organise a marketing event.
Read more about value creation pedagogy in higher education:
Lackéus, M., Hyldegård, J. S., & Færgemann, H. M. (2025). Value creation pedagogy across disciplines in higher education: Approaches and motivations. International Journal of Management Education, 23(3), 1-14.
3.4 The DAS Form – Captures Everyday Life and Provides Rhythm
In the DAS method, a special form is used that constitutes the fixed structure through which all data is collected. Figure 3.4 below shows what the form looks like and how the different parts work together to transform everyday events into researchable knowledge.
The DAS form is used digitally and filled in directly after each completed action. It consists of a few open questions where the participant describes what was done, how it felt and what effects occurred. In addition, there is a feeling rating, choice of keywords to categorise the experience, and at the bottom a comment field where the study leader can initiate a dialogue with the participant about that particular action and reflection. In this way, both the quantitative and qualitative aspects of everyday experiences are captured.
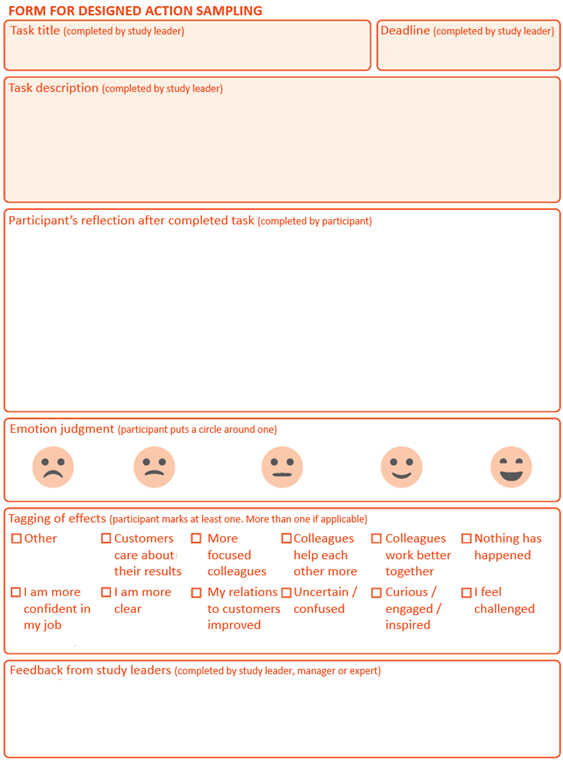
Figure 3.4. The form for DAS – only the tags are filled in in this example.
Read more:
Lackéus, M. (2021). Den vetenskapande läraren. [The Inquiring Teacher]. Chapter 4.
The form is used not only to document insights and effects, but also to enable learning in the moment. It helps people reflect on their actions, make their experiences visible, and contribute to a shared analysis of what works, why and in what contexts. By being filled in continuously, it becomes a rhythmic part of the DAS process—each action is followed by a reflection, and each reflection becomes a data point in a growing knowledge system.
3.5 Action Task – An Experiment That Generates Learning
The action task is the core of DAS method because it transforms everyday actions and thoughts into high-quality scientific empirical data. An action task is a carefully thought-through action that is designed to evoke learning and insights among participants through practical doing. It is thus a kind of carefully formulated trial, a social experiment that is carried out by many participants and is always followed by written individual reflection. Action and reflection are thereby closely connected, which makes each action task a microscopic research process in itself. Ideally, each action task is also designed based on the inquiry question being explored, and which participants are keen to get answers to.
Actions can take many different forms. It might involve asking someone for something and being rejected, seeking feedback on a particular idea, trying a new way of working, speaking with different people in your network about something specific, testing a new method in customer contact, having a difficult conversation, or inviting a colleague to joint problem-solving. Regardless of form, the action task should feel meaningful and allow space for emotional engagement, because feelings often signal that something important has happened. Then the reflections become more interesting.
It’s not always that action fits. Action tasks can therefore also be of a more reflective character. Figure 3.6 below describes four different basic types of action tasks: (1) planned actions that test an idea in practice, (2) attitude-changing actions that aim to try a very simple action that doesn’t require any planning beforehand, (3) reflection based on any emotionally strong event, and (4) pure theme-based reflection around a given topic. A common application of pure reflection is the so-called SWOT analysis, where DAS is used to collect reflections from a group of employees about how they view the organisation’s strengths, weaknesses, opportunities, and threats.
In Chapter 4, we go more deeply into how action task design works.
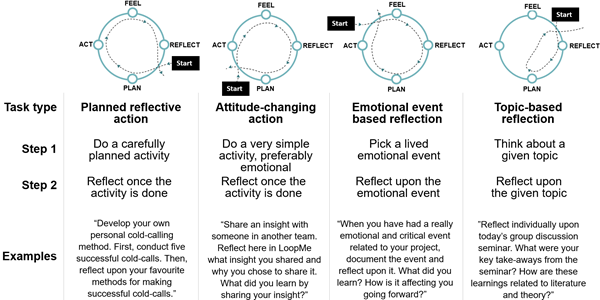
Figur 3.5. Four different task types, illustrated with Kolb’s learninc cycle.
Read more:
Lackéus, M. (2020). Collecting digital research data through social media platforms: can ‘scientific social media’ disrupt entrepreneurship research methods? . In W. B. Gartner & B. Teague (Eds.), Research Handbook of Entrepreneurial Behavior, Practice, and Process. Edward Elgar Publishing.
Lackéus, M., Sävetun, C., & Westlund, C. (2020). Lärares vetenskapliga lärande med IT‐stöd – vad, varför, hur? [Teachers’ scientific learning with IT support – what, why, how?]
3.6 Feeling Rating – When Feelings Become Scientific Data
Feeling rating is DAS method’s way of systematically capturing the emotional side of human action. Each time a participant has carried out a task, their feeling must be rated—a choice among five possible alternatives, from strongly negative (−2) to strongly positive (+2). This happens via a simple button press in the digital form, linked directly to the written reflection. In a few seconds, the feeling is transformed into data, which makes it possible to analyse how people actually experience their actions in the moment.
Behind this simple move lies solid science. The feeling scale is based on the so-called Circumplex model of affect (see Figure 3.6 below), which places feelings along two axes—valence (positive–negative) and activation (low–high energy). In DAS, primarily the valence dimension is used, which provides a clear and user-friendly measurement of the emotional direction of experiences. The design has also drawn inspiration from the Self-Assessment Manikin, a non-verbal method for expressing one’s feelings through visual symbols, in this case via five emojis, which makes the rating quick, intuitive and inclusive.
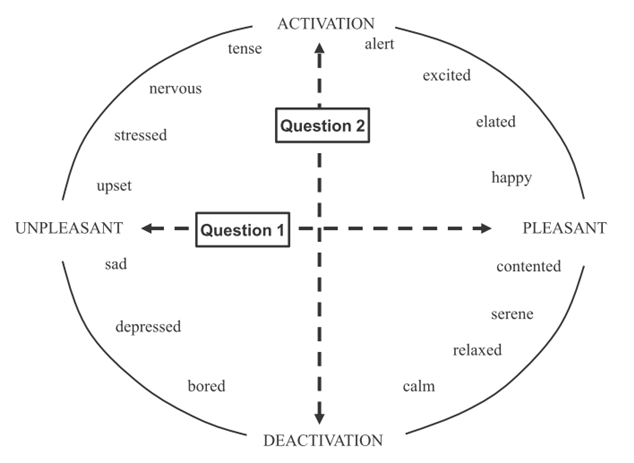
Figur 3.6. The Circumplex Model of Affect (Russell, 1980; Lackéus, 2014). The model shows feelings along two axes: valence (positive–negative) and activation (low–high energy).
Feeling rating also helps participants. Pausing, sensing and rating the feeling deepens reflection. The feeling rating thus becomes both research data and reflection support. It shows when something feels meaningful, challenging or joyful, and points to the moments where learning is most alive. In the analysis, mean values for feelings are then linked to reflections, tasks and tags, which makes it possible to identify patterns in how different actions affect feelings, thoughts and development. Strong feelings, positive or negative, often signal that something important has occurred.
Read more:
Russell, J. A. (1980). A circumplex model of affect. Journal of personality and social psychology, 39(6), 1161.
Lackéus, M. (2014). An emotion based approach to assessing entrepreneurial education. International Journal of Management Education, 12(3), 374-396.
3.7 Tags – Indicators of Interesting Effects and Experiences
A tag in the DAS method is a brief phrase of no more than four to five words that summarises an experience, an effect or a behaviour of interest in the learning process. Tags can be both positively and negatively charged. They are displayed as digital buttons in the DAS form. The participant chooses the tag or tags that best describe the experience of a completed action task. In this way, complex experiences are transformed into structured data, without losing the connection to the person’s own interpretation of the event.
Tags provide a quick overview of what participants experienced as important, meaningful or difficult, and simultaneously function as indicators of how the attempt to do something valuable in everyday life went. The tags constitute the numerical “door in” to a qualitative analysis of connections between causes (the action tasks) and effects (the resulting experiences participants write about). When many participants choose the same tags in connection with a particular action task, patterns emerge that show different effects in different contexts.
In practice, suitable tags are often chosen and designed together with participants at the beginning of a DAS study. Being involved in formulating tags creates participation—”What effects do we want to see?” New tags can also be created continuously based on patterns in participants’ reflections. Examples of tags might be “New insight”, “Improved relationships”, “Meaningful”, or “Difficult”. Together they form a map of experiences and effects in everyday life.
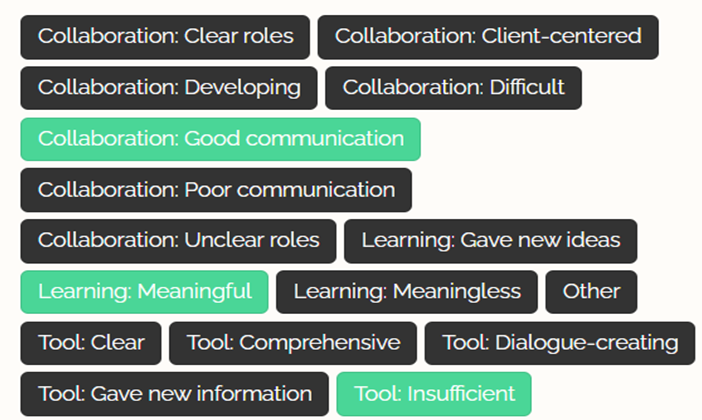
Figure 3.7. An example of a set of tags in a study about teaching in schools.
Read more:
Lackéus, M. (2021). Den vetenskapande läraren. [The Inquiring Teacher]. Chapter 7.
3.8 Comment Thread – Confidential Conversations with Scientific Power
A comment thread in the DAS method is a formative dialogue that can follow each submitted reflection. A digital conversation often arises between the participant and those leading the study. A reflection then becomes the starting point for a personal conversation rather than an isolated survey response. The comment thread means that data collection doesn’t stop at a submitted text, but often develops into a mutual exploration of experiences, feelings and insights.
The purpose is both relational and scientific. Relationally, the comment thread creates a confidential feeling where the participant feels seen and taken seriously, which in turn increases engagement and quality in subsequent reflections. Scientifically, it provides access to deep data. Deepened dialogue and initiated follow-up questions hold far higher quality than traditional survey responses. Where a free-text field in a survey often gives impersonal and anonymous snapshots, the comment thread creates a living, personal and confidential conversation sequence that can then be analysed as text-based empirical material.
Examples of areas of use are in leadership development, coaching, supervision, development work, teaching and organisational change. In practice, comments are written digitally in a social flow, directly under each reflection (see Figure 3.8). The IT support reminds the parties so they don’t forget the ongoing dialogue. When giving feedback in a comment thread, leaders should keep in mind that the aim is to support deeper reflection, not to evaluate the participant or provide superficial positive remarks. Many experience this as difficult because it requires a balance between being curious, respectful, and challenging at the same time.
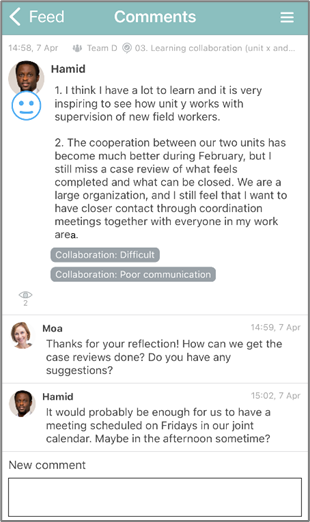
Figure 3.8. Comment thread with a leader and a participant commenting on a reflection.
Read more:
Lackéus, M. (2021). Den vetenskapande läraren. [The inquiring teacher] Chapter 7.
Magnusson, A., Lackéus, M., Ohlsson, K., & Holmén, P.-E. (2023). Praktiknära SKA-arbete: En ny modell för ett mer meningsfullt och mer vetenskapligt systematiskt kvalitetsarbete [Practice-based systematic quality work: A new model for more meaningful and more scientific systematic quality work]
3.9 Content Package – Shareable Structures for Proven Experience
A content package in the DAS method is a ready-made knowledge object—a complete set of between three and twenty action tasks with associated tags, designed to spread and test an idea among a wider audience. It is a comprehensible and usable form for sharing a well-thought-out set of actions and effects that others can access, carry out and further develop.
The content package fulfils many different purposes. It functions as a bridge between theory and practice, where research-based design principles are translated into testable actions. At the same time, it creates a structure for collective learning—different groups can use the same set of action tasks and tags, share and compare their results, and together refine the content. The content package also opens up for self-selection—practitioners can choose the themes that feel most relevant to their reality, which in turn shows the design team which issues seem to have the greatest practical relevance. Thereby the gap between research and practice is reduced, because knowledge can be spread in a more concrete and applicable form. The content package also contributes to a democratisation of research, by enabling many more people to participate in developing and testing different methods described in action task and tag form without themselves being academic researchers.
In practice, a content package can be used in a unit, organisation or municipality, for example around themes such as sustainable leadership, co-creating culture, or value-creating meetings. Each time it is used, new data is generated that can be analysed and compared. Study leaders can then further polish the language, action tasks, tags and structure. When many have worked with the same content package in different contexts but with similar results, it can be regarded as proven—a collectively developed and verified form of practical knowledge.
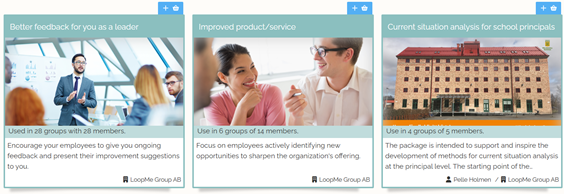
Figure 3.9. Examples of three content packages in the Loopme library.
Read more:
Lackéus, M. (2021). Den vetenskapande läraren. [The inquiring teacher] Chapter 6.
Lackéus, M., & Sävetun, C. (2025). Designed Action Sampling as a new research method to help build active communities in entrepreneurial education. Entrepreneurship Education & Pedagogy 8(2), 206-239.
3.10 A Comparison with Interviews and Surveys
This chapter concludes with a comparison between DAS and two more established ways of collecting people’s thoughts—interviews and surveys. At first glance, DAS may resemble a survey, but the comment thread makes it possible to have ongoing conversations and ask follow-up questions, which rather brings to mind an interview. DAS can therefore rather be seen as a particularly successful combination of the two.
Table 3.10 below shows how DAS unites the interviews’ strengths in depth, context sensitivity and handling of complex questions with the surveys’ strengths in scale, pace and comparability. At the same time, several of each method’s weaknesses are mitigated. Compared to interviews, DAS enables more voices to be heard at a lower time cost. Compared to surveys, contextual aspects, emotional nuances and participants’ perceived value are preserved. The result is a method that holds together pace and depth, individual learning and collective analysis—a balance that makes DAS particularly suited for everyday inquiry.
Table 3.10. Comparison between three different methods. Interviews, DAS, and surveys are contrasted based on a number of different dimensions.
| Dimension | Interviews | DAS | Surveys |
| Type of data collected | Spoken words and body language presented in confidential meeting | Written text, numbers, and feelings presented in confidential social media | Numbers but sometimes also written text delivered as anonymous responses |
| Typical number of participants | 15 | 15-100 | 50-500 |
| Quantifiability of results | Low | Medium | High |
| Time spent on preparation | Medium | Medium | High |
| Time spent on data collection | High | Low | Low |
| Time spent on data analysis | High | Low | Medium |
| Geographic challenges | Medium | Low | Low |
| Suitable for complex problems? | Yes | Yes | No |
| Longitudinal studies possible? | Yes, but resource-intensive | Yes, as standard | Yes, but problems with response rate |
| Generalisability of results | Low | Medium | High |
| Suitable for gene-rating new ideas | Yes | Yes | No |
| Allows anonymous respondents | No | Partly | Yes |
| Context sensitivity | High | High | Low |
| Value for participants | Low to medium | High | Low to none |
Read more:
Lackéus, M. (2020a). Collecting digital research data through social media platforms: can ‘scientific social media’ disrupt entrepreneurship research methods? . In W. B. Gartner & B. Teague (Eds.), Research Handbook of Entrepreneurial Behavior, Practice, and Process. Edward Elgar Publishing.