


Now we come to the third and final step in DAS, where the S stands for “Sample the impact”. How did it go for us? What did we learn? And what would be wise to do next? At its core, analysis is about learning together at depth – stepping back to draw lessons from what has happened, what we have thought, and what we have tried. The goal is to make wiser decisions going forward. This is what separates intelligent action from thoughtless, habitual and unreflective action.
The brilliance of us humans is that we are equipped with a remarkable organ that does such analysis for us – our brain. The brain’s most important role is to use previous results of social interactions as guidance for future decisions. The brain thus does not work in isolation. We learn by the body doing things out in the world – we plan, act, feel and get feedback.
Learning at work functions in the same way. We understand deeply only when we see what our various actions lead to at individual, group and organisational levels. When many people do and then share their experiences socially, something powerful happens – many brains begin to think as one. In our connected society this often happens with the help of various technical systems – computers and connected software from companies like Microsoft, Google and Facebook. We then get a particularly powerful form of socio-technical intelligence to “think” with. A classic example from cognitive science research is the aircraft cockpit. In the cockpit’s socio-technical system, information is stored not only in a single pilot’s brain or in a single instrument, but in a complex “thinking” network consisting of two pilots’ brains, the aircraft’s support instruments and well-described work routines (Hutchins, 1995).
DAS works in the same way, but on a larger scale and with the purpose of answering the inquiry question we have posed. Through everyday inquiry, we establish a socio-technical system for intelligent learning consisting of people, actions, clear work routines and digital support that together constitute a collective “brain”, a kind of “wisdom of crowds” we ourselves can steer in the desired direction. Then insights are gathered that would otherwise disappear in everyday life. Analysis is when this shared socio-technical brain “thinks” – when we see our collective actions from the outside, discover patterns and draw wise conclusions for a better future. It is in the analysis phase that DAS shows its real power to transform everyday activity into deep insight. We strengthen our shared intelligence and analytical capacity so that together we can better understand and develop our organisation’s collective work.
Read more:
Clark, A. (2013). Whatever next? Predictive brains, situated agents, and the future of cognitive science. Behavioral and Brain Sciences, 36(03), 181-204.
Cowart, M. (2013). Andy Clark, Antonio Damasio and embodied cognition In A. Bailey (Ed.), Philosophy of Mind: The Key Thinkers (pp. 17). Bloomsbury Publishing.
Hutchins, E. (1995). How a cockpit remembers its speeds. Cognitive science, 19(3), 265-288.
6.1 Why Analysis – Deeper Insights, Better Decisions, Better Operations
If your organisation already performs at its absolute best, in a world that never changes – delivering exactly what is needed, across every dimension you can think of, as well as it possibly could, consistently over time – then you have no need for analysis. But of course, no such organisation exists.
Analysis is needed when we want to reach further than we have so far. When the world around us shifts and we need to adapt. When we want to get better at achieving our goals. When others seem to be succeeding where we are struggling. Perhaps someone from outside has told us that, given the resources we have, we ought to be doing better. In all of these situations, strong analytical capacity is exactly what is needed – and DAS can give us that.
Analysis helps us see ourselves more clearly and understand what is actually going on, so we can make wiser decisions and build better organisations. It also shows us what our new ideas are actually achieving. Outside critics may have pointed us towards something that has worked well elsewhere, and that can be genuinely useful. But we still need to find out whether it works here, in our own context. No new idea arrives with a guarantee for success. Analysis is needed.
Analysis also corresponds to steps 4, 5 and 6 in all scientific work, see figure 6.1 below. What findings did we get? For whom did value arise, when and how? How do these experiences relate to humanity’s previous knowledge? What are the implications? How do we now answer our inquiry question? Such analysis also creates trust and engagement among participants – everyday inquiry becomes meaningful practice, especially through its practice-based “people’s science” analysis.
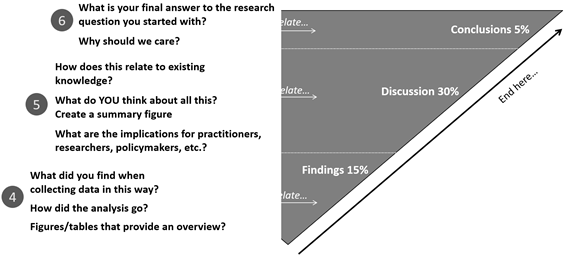
Figure 6.1. The endpoint for an everyday inquiry – findings, discussion and conclusions.
It may seem that analysis is the final step in everyday inquiry – but it is actually the second to last step. The very last step, and in many ways the most important, is to actually keep doing more of what works well for us. To sustain the change over time. To do less of what did not work for us. And to be willing to try again, rather than falling into the familiar trap of saying “we tried that once and it didn’t work”.
Read more:
Lackéus, M. (2021). Den vetenskapande läraren. [The inquiring teacher]. Chapter 8.
6.2 As You Sow, So Shall You Reap – Garbage In, Garbage Out
How do you actually do the analysis work in practice? We will get to that shortly. But first we must remember that strong analytical capacity requires that we have done our homework in steps one (D) and two (A) of everyday inquiry work. In my own research I have many times become painfully aware that my analytical capacity is completely dependent on how I proceeded when I designed the study and then collected data. I sit there with worthless data.
In computer science there is a basic rule for this, abbreviated GIGO – Garbage In, Garbage Out. If we feed a computer with rubbish data, we will also get a rubbish analysis. No AI engine in the world can save the analysis if we’ve been sloppy getting there. If participants receive action tasks that don’t let them reflect on their own actions or experiences, the reflections often become uninteresting. If the reflection tasks don’t feel genuinely important or emotionally engaging, then we get pretend-reflections. If the action task text doesn’t give participants support in how to reflect deeply, then we get rubbish data. If I didn’t set aside time to give participants feedback on their reflections while the data collection was ongoing, then I pay dearly for it in the analysis work.
What every farmer knows therefore also applies in everyday inquiry – as you sow, so shall you reap, see figure 6.2. A good sowing consists of good action tasks and tags, good support for participants that builds up good habits of reflecting and leadership that supports. But the combine harvester and tractor are equally important. Imagine harvesting a whole field by hand with a scythe. No farmer works like that today. Time-efficient data collection and visualisation of well-structured data is absolutely necessary for functioning analysis work. Here IT tools like Loopme can help us collect high-quality data and then produce numbers and diagrams that help us see patterns. Only then do we get rewarding analysis that genuinely helps our organisation become better over time.
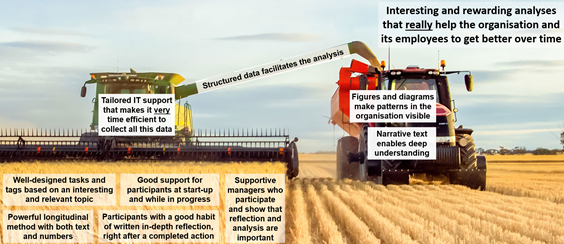
Figure 6.2. As you sow, so shall you reap. Strong analytical capacity requires well-functioning data collection.
Read more:
Lackéus, M. (2021). Den vetenskapande läraren. [The inquiring teacher]. Chapter 8.
6.3 Starting the Analysis Immediately – Walking Alongside Formatively Instead of Following Up Later
A strength of DAS is that data is collected over time. You can compare it to the difference between photo and video. A classic survey is like a photo. What did it look like right there and then? “Oh, he was blinking!” With DAS we instead capture processes more continuously, a bit like recording video that captures movements and dynamics. This is called working longitudinally, a word that comes from the Latin word longitūdō; the study continues over time. Longitudinal studies are preferable because we can then follow dynamic processes. However, they are often expensive and difficult to achieve in practice via traditional surveys or interviews. How fortunate then that DAS is an inherently longitudinal method – the same form is filled in many times by the same people, albeit with different action tasks.
In the analysis we should try to take advantage of DAS being a longitudinal method. We should begin the analysis as soon as data collection has started, in a formative way, while the study’s outcome is still being “formed”. Then we can be there and walk alongside people in their ongoing practice, rather than relying on traditional after-the-fact follow-up. We become fellow travellers on participants’ journeys, every week or every other week, as they try out different things. We give encouragement, ask curious questions, puzzle together about why it went the way it did. The action tasks we designed for participants become a kind of fine-grained weekly learning we ask them to engage in together with us, see figure 6.3 below. This makes an everyday inquiry much more relational, intimate and personal than classic survey follow-up.
In an approach based on walking alongside, reciprocity is therefore essential – a mutual give-and-take. Try to strive for the work to be experienced as study leaders and participants learning together. Not just receiving participants’ reflections, but also giving something back in the form of feedback and analysis overviews. One participant said it feels like getting a pen pal. Try to create that feeling.
Figure 6.3. – Fine-grained learning is triggered by DAS and captured via formative analysis (figure from Lackéus, 2021, p.119).
Read more:
Lackéus, M. (2021). Den vetenskapande läraren [The inquiring teacher], Chapters 6-7.
Neale, B. (2018). What is qualitative longitudinal research? Bloomsbury Publishing.
Lackéus, M. (2025). “I have All the Feelings”: Navigating the Emotional and Practical Challenges of Research Method Innovation in Entrepreneurship Education. ECSB 3E, May 20-22, Munich.
6.4 Mixed Analysis in Five Steps – Tags, Action Tasks, Free Text, Anonymisation, Dialogue
When all action tasks are completed, it’s time for a summarising analysis. First transfer the group’s reflections to a spreadsheet. In Loopme you do this by going to the Members tab in your group, and choosing “Export loops and reports”. Then you download a so-called CSV file (“Comma Separated Variables”), a text file with commas between each value. Don’t open the file directly. Instead, open a blank spreadsheet in Excel and import your CSV file via the Excel tab “Data” -> “From text/CSV”. Then you import all reflections so that it becomes easy to sort them by action task, feeling or tag, see figure 6.4.1 below. If you see text and numbers all jumbled up in Excel without the ability to sort anything, then something has gone wrong.
What we now have before us is so-called mixed data – a mixture of numbers and text. We will now engage in mixed analysis, and it happens in five steps, see figure 6.4.2 below. Start sorting by tags, feelings or action tasks, and then move on to reading interesting texts at the top of the sorting. Increase the size of the reading window so you can read a whole reflection in the window above all the cells. I usually start by reading reflections with the highest and lowest feeling values respectively. What has been most positive? Most challenging? Then I might move on to a certain tag or an action task that stands out. Which action task is this tag most common on? What do participants write then? Then I cut out interesting texts and paste them into a PowerPoint document that I can show to participants in my inquiry.
There are many good ways to engage in mixed analysis beyond following these five steps to the letter, but mixed analysis is fundamentally about going back and forth between numbers and text, creatively searching for interesting insights and patterns, and bringing along those nuggets of quotes that can then be shown anonymously to many.
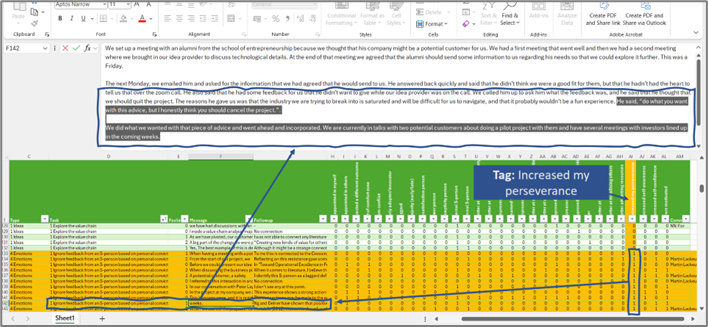
Figure 6.4.1. What it looks like in Excel when you move between tags, action tasks and free text.
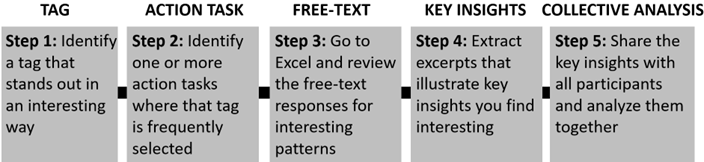
Figure 6.4.2. Mixed analysis in five steps from tag and action task via free text to collective analysis.
Read more:
Lackéus, M. (2021). Den vetenskapande läraren [The inquiring teacher]. Chapter 8.
6.5 Collegial Analysis – Analysis Meeting, Digital Analysis Space, Other Ways
A collegial analysis meeting can be conducted in many different ways, but the main focus should be to let participants engage with different summaries and discuss them together, see for example the overview with different figures from Loopme in figure 5.5 in the previous chapter. The purpose should be to gain new insights that are then captured via concluding written reflection, around questions such as: Why do we think we got this outcome? What is it that deeply makes a difference here? How can we succeed better next time? What do we now want to suggest to others? What changes do we now want to implement?
The meeting can follow the structure IPAI – Individual reflection, Pairwise discussion in small groups, All discuss together in the whole group, Individual reflection again. The study leaders can begin by going through the analysis material they have produced, consisting of say 4-6 images with graphical compilations and thematised extracts of anonymous reflections, see example in figure 6.5 below.
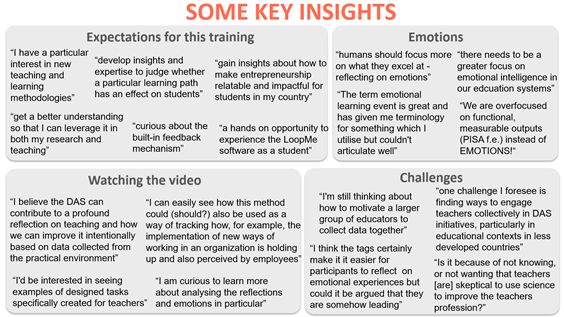
Figure 6.5. Example of a thematic analysis in PowerPoint with pasted free texts from Excel, consisting of illustrative reflections among participants in an inquiring practitioner training.
It can be good to print out the analysis material in a few copies on paper so that participants can browse around at their own pace. Sending out support material digitally in advance can also work. Collegial analysis can also take place digitally in a separate flat group in Loopme, ideally then as a complement to a physical collegial analysis meeting.
Many think they have an open sharing culture. But the fact is that most workplaces struggle with various group dynamic phenomena such as defensive colleagues, secrecy, competitive mentality, resistance to change, rivalry. Anonymous sharing is then a useful technique and constitutes a middle way between total openness and total closure.
Read more:
Lackéus, M. (2021). Den vetenskapande läraren [The inquiring teacher]. Chapter 8.
Argyris, C., & Schön, D. A. (1978). Organizational Learning: A theory of Action perspective. Addison-Wesley Publishing Company, Inc.
6.6 Thinking Like a Data Analyst: Some Advice from Wendy Ruona
How should we actually think as an inquiring practitioner when it comes to data analysis? I think the chapter “Analyzing Qualitative Data” by researcher Wendy Ruona is an excellent introduction to precisely this. Analysis according to Ruona is about slowly letting understanding grow out of the material. Sensing what is happening, becoming deeply familiar with the data until it almost begins to talk back. By reading, listening and returning to the material over and over again, insights slowly emerge, first as faint hints, over time clarifying into clear patterns.
The next step is to make constant comparisons – compare different reflections with each other, sketch suitable categories, reformulate the categories and try to group the insights into different themes. Every new observation you make casts new light on the old, every new category you try to put words to you can test against everything that has already been written. In an everyday inquiry this begins already during the data collection itself. In this way, understanding, categories and themes of insights grow in parallel. To not get lost in this complex flow of ideas we need to work from our inquiry question which sets a clear direction, holds the work together and helps us determine what is most relevant.
When increasingly clear patterns begin to emerge, it’s good to draw models and figures. Such visual work deepens thinking, makes the diffuse more graspable and helps to see relationships between different parts. Throughout the process it’s also important to alternate between letting insights rise from the data and formulating hypotheses in advance that are then tested against the reflections. Finally comes perhaps the most difficult but also most satisfying step: to theorise. To generalise from the concrete, test our interpretations against new reflections and slowly approach a coherent explanation – our own theory that grows out of both the material and our newly gained insights around reflections, categories and themes. I have tried to summarise Ruona’s advice in Figure 6.6 below.
It’s also good to work with triangulation, which means comparing different data types with each other. Or why not count the number of occurrences of different interesting phenomena – both high and low occurrence is interesting. Do look at extreme cases of various kinds, in both positive and negative senses. Think about deviant phenomena that stand out, often unusual reflections. Also look for things that surprise in general.
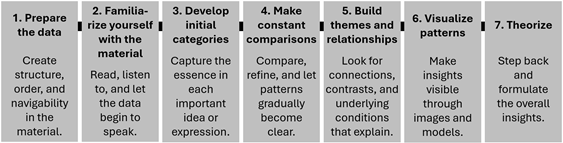
Figure 6.6. Seven steps in Ruona’s proposed process for qualitative data analysis. Research is not linear, however, so we need to go back and forth a lot between these seven steps.
Read more:
Ruona, W. E. A. (2005). Analyzing Qualitative Data. In R. A. Swanson & E. F. Holton (Eds.), Research in organizations: Foundations and methods in inquiry (pp. 233-264). Berrett-Koehler Publishers.
6.7 Critical Perspectives on Data Analysis
It is a great advantage in analysis work to be well familiar with what we are studying, but it also involves some challenges. In DAS we are both observers and participants simultaneously, which means that our own expectations, feelings and experiences easily influence what we see. We need to learn to recognise different kinds of bias in our analysis work – distortions due to our partial preunderstanding – and actively handle them.
The most well-known is confirmation bias – the tendency to notice things that confirm our expectations and downplay things that disturb. But there are more, see figure 6.7 below. Availability bias makes us overestimate what is easy to remember or already close at hand. Group bias can arise when colleagues share the same perspective and thereby reinforce each other’s interpretations. Positivity bias makes us overemphasise what works well, especially when we ourselves are part of the studied system. All research methods are affected by hidden bias, but we can make them more visible by writing short analysis memos, for example as comments on participants’ reflections. Such reflective notes show how our insights have continuously grown and make our interpretations traceable so we can more easily see afterwards where bias may have crept in.
Another important step in the analysis is to critically test one’s own understanding, to consciously seek what chafes. Look for contradictory examples in the data. Reflections that break the pattern, feelings that go in another direction, quotes that don’t fit in, thoughts we would rather not have read about. Such deviations make the analysis both deeper and more credible. Also compare different data types – numbers, feelings and text – to see if they point in the same direction. Another simple technique is to count. How often does a theme or a feeling recur, and where does it differ? Both frequent and unusual themes are interesting, though for slightly different reasons. We can also let others read the same material and compare interpretations, for example at a collegial analysis meeting. We can also test our conclusions against rival explanations, alternative ways to understand the same phenomenon. When we actively try to disprove ourselves, the analysis becomes more robust.
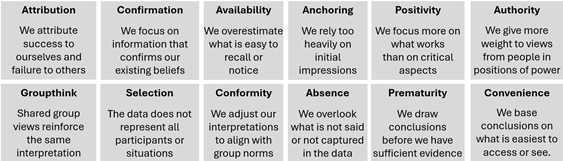
Figure 6.7. Some common distortions or biases in analysis work that risk leading us astray.
Read more:
Lackéus, M. (2021). Den vetenskapande läraren [The inquiring teacher], chapter 8.
Kahneman, D. (2011). Thinking, Fast and Slow. Farrar, Straus and Giroux.
6.8 Quality Management with the Help of DAS as Analysis Engine
All organisations conduct some form of quality work. In schools it’s called school improvement work or systematic quality improvement, in healthcare quality management systems, in social services continuous improvement work and in business quality management systems or PDCA cycles – Plan-Do-Check-Act. Regardless of name, it’s about planning, implementing, following up and improving operations based on data and reflection. The difference lies in the degree of life – whether quality work is administrative paperwork or a living quality dialogue. DAS makes quality work concrete: in the Design phase (Plan) action tasks and purposes are formulated, in the Action phase (Do) participants carry out their actions in everyday life and in the Sample phase (Check/Act) data is collected, analysed and fed back. In this way quality work does not become a separate process but part of everyday learning.
In Hässleholm in Sweden, around 60 headteachers have used DAS to make quality improvement work more practice-based. They call it practice-based systematic quality work. Follow-up now happens continuously instead of a few times per year, and the work has become simpler, more frequent and more meaningful. The headteachers describe a shift from extensive to simplified, from seldom to often, from individually to together and from superficial to deeper, see figure 6.8 below.
With DAS as analysis engine in quality work, improvement cycles are moved more into everyday life. The analysis then does not become a heavy final step carried out by a few managers or quality managers, but a continuous and collective learning process that drives practice forward. When planning, action and analysis are bound together in digital everyday inquiry loops, the PDCA cycle becomes a more human and meaningful process driven by curiosity rather than control.
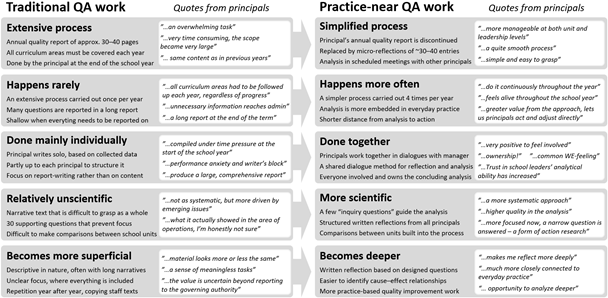
Figure 6.8. Traditional and practice-near quality work (Magnusson et al., 2023).
Read more:
Magnusson, A., Lackéus, M., Ohlsson, K., & Holmén, P.-E. (2023). Praktiknära SKA-arbete: En ny modell för ett mer meningsfullt och mer vetenskapligt systematiskt kvalitetsarbete [Practice-based systematic quality work: A new model for more meaningful and more scientific systematic quality work]
6.9 Use of AI in Qualitative Data Analysis
In an everyday inquiry there can be large amounts of text to be analysed by study leaders – from a few thousand words to up to a hundred thousand words, which corresponds to several thick books. I have myself done many such text analyses manually over the years, and it has long been the most difficult step to teach in everyday inquiry. Here AI technology recently came in as a welcome rescue. Now we can ask an AI engine to look for patterns and anonymous quotes from participants’ reflections, both while the study is ongoing and when it’s time for summarising. It goes quickly and works exceedingly well, our method research shows. Participants in collegial analysis meetings also place great value on the AI overviews.
We have built in a first version of AI support in Loopme, so that users with a single click can get an AI analysis of everyone’s reflections in a group or on a specific action task, see an example of such an analysis report in figure 6.9 below. AI thereby becomes yet another component in the socio-technical system DAS represents – yet another brain that participates when many brains think as one.
At the same time, AI-supported everyday inquiry analysis requires a critical stance. Algorithms carry their own distortions and lack understanding of context. Therefore the results always need to be tested against people’s experience via collective reflection. The AI analysis’s quality is also affected by how well we have managed the sowing – the GIGO rubbish rule also applies to AI analysis. There are also legal, security and ethical perspectives that need to be taken into account. But we see that it is worth the effort. AI opens up completely new possibilities through a radical simplification of DAS analysis. Quality work now becomes even simpler, and more people can participate.
Read more:
Lackéus, M. (2025). “I have All the Feelings”: Navigating the Emotional and Practical Challenges of Research Method Innovation in Entrepreneurship Education. ECSB 3E, May 20-22, Munich.
6.10. Concluding Reflection on DAS Analysis
After having gone through the craft of DAS analysis based on a number of practical steps and techniques, I want to end this chapter by raising my gaze. Analysis in DAS is fundamentally about quite a lot of practical work with numbers and text, but it is also about collective sense-making. When people pause and together try to understand what their actions have led to, something deeply human emerges – a collective capacity to think, feel and learn. It is in this sense-making process that quality and development work draws its strength. Analysis then becomes not just a technical task but also a shared reflection process about what works, why it does and how we can get more of it.
At the same time, analysis is also emotional. Our reflections carry joy, frustration, pride and doubt – all that makes us alive. Where there are strong feelings there is also strong learning. When we dare to let feelings become an important part of the analysis, we gain access to the energy that drives deep learning and real change. Therefore analysis needs to happen in trusting relationships where people dare to do, share, listen, feel and think together. Everyday inquiry makes this possible by weaving together the cognitive and the emotional, the individual and the collective, the written and the spoken, the digital and the human.
Fundamentally, DAS analysis is thus an expression of a kind of scientific democracy – research for the people, or people’s science. It is a method that distributes thinking and speaking space to many more, where insights are not so much produced by experts at a distance but rather grow where everyday life unfolds. The purpose of analysis is therefore not to control but to understand, not to scrutinise but to improve. When we close the analysis loop with new and wiser actions, learning becomes more sustainable and operations more human. We return to this in chapter 10.
But analysis is also about rhythm – creating balance every week between working and learning. If we seldom pause and reflect we lose direction, but if we only analyse nothing new will happen. In everyday inquiry these movements alternate all the time: work triggers learning, and learning triggers new work. This is what creates a sustainable work–learn balance in the organisation, where improvement and production go hand in hand. Everyday inquiry is thus about learning-oriented value creation: creating more value through learning – for those we are here for, for each other and for ourselves. Translating new insights into actions that make a real difference in everyday life for all those affected by our work. For a deeper exploration of how work and learning can be better balanced in everyday life, see my article on “Work-learn balance” below.
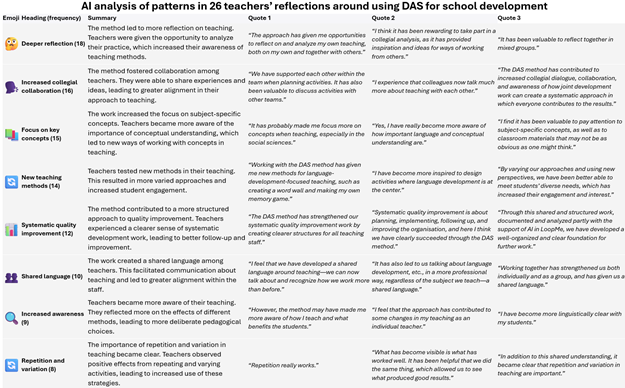
Figure 6.9. AI analysis of what 26 teachers thought about using DAS.
Read more:
Lackéus, M. (2023). Work-learn balance – a new concept that could help bridge the divide between education and working life? Industry and Higher Education, 38(2).